A professional Data Analyst
Data Analyst | Business Analyst | BI Developer | Data Visualization Specialist
Welcome to my portfolio! I'm Peter Makori, a data analyst and business intelligence developer based in Nairobi, Kenya. I specialize in transforming complex data into actionable insights through interactive dashboards, compelling visual stories, and efficient reporting systems.Over the past three years, I have developed deep expertise in tools such as SQL, Python, Power BI, Tableau, and Excel, enabling me to design impactful dashboards, automate reporting, and support data-driven decision-making across multiple industries. From budget optimization to operational analytics and performance monitoring, I bring clarity to complex datasets and help businesses uncover opportunities.
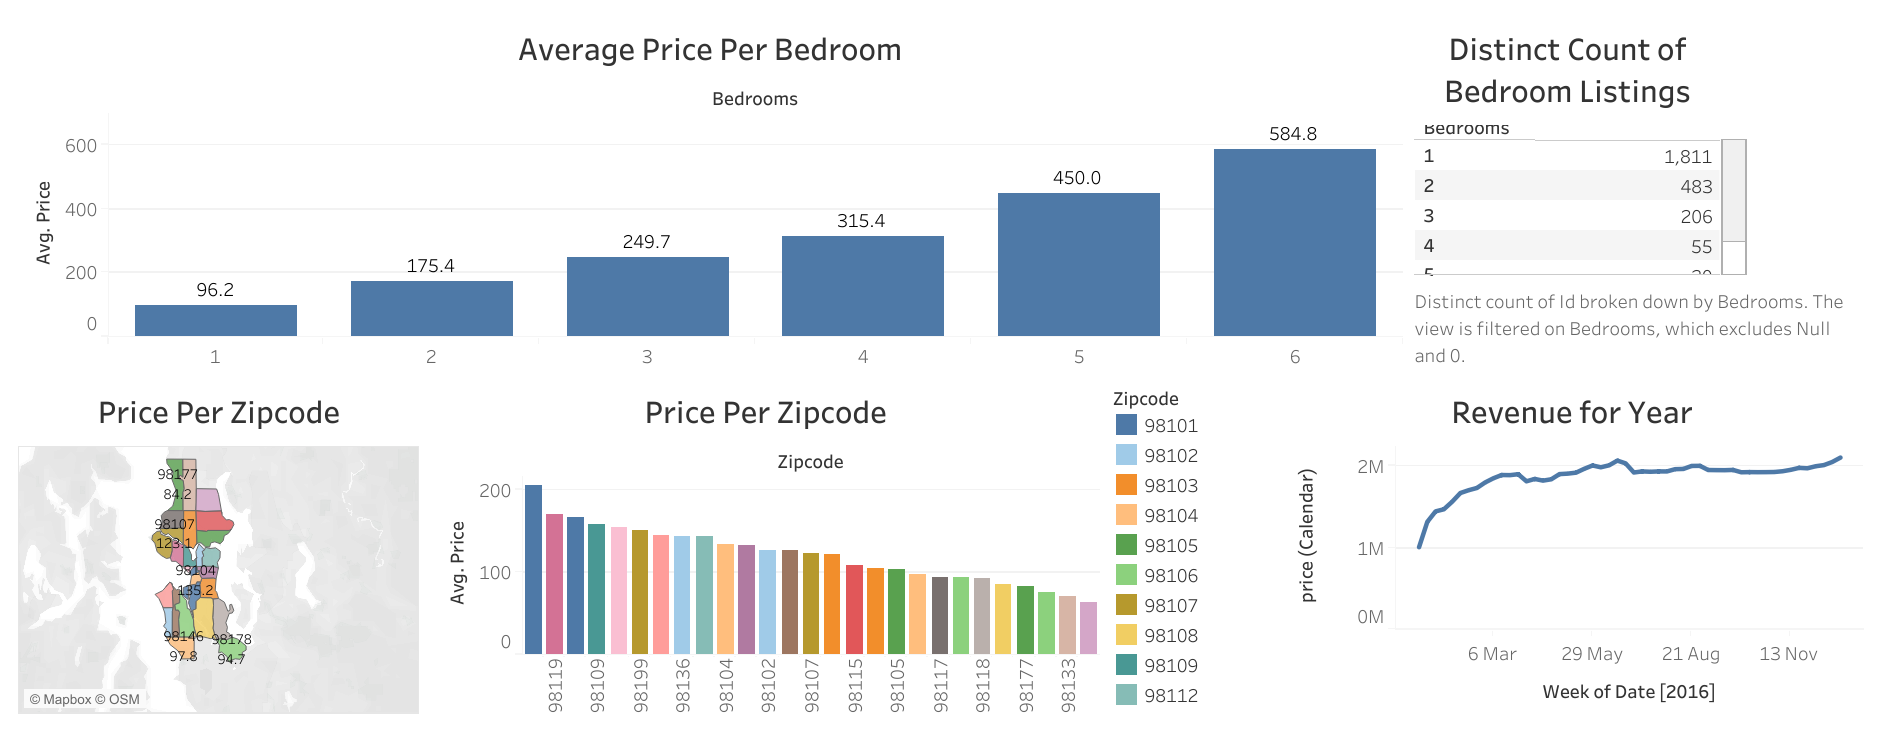
My work includes building Airbnb analytics tools that increased host revenue, creating financial reports that guided smarter budget planning, and developing manufacturing dashboards that improved efficiency tracking. I focus on delivering insight-driven solutions that are both technically sound and visually engaging.
Passionate about data storytelling and real-world problem-solving, I thrive on turning raw information into clear, strategic direction. If you're looking for a data partner who blends technical precision with creative thinking, I invite you to explore my work. Check out my portfolio, explore my GitHub , or connect on LinkedIn .Explored correlations in film industry data for over 7,000 movies using Pandas and statistical methods. Findings provided actionable insights on production budget allocation.
Cleaned raw movies data and conducted exploratory analysis using Pandas and Matplotlib to graph trends in budget, revenue, and financial predictors of movie success.
Built interactive Tableau dashboard for Airbnb hosts to analyze listing occupancy and optimize pricing, increasing revenue by 10%.
Designed BI solution to track 100+ KPIs for manufacturer locations, enabling optimized production planning.
Wrote advanced SQL queries statements encompassing data manipulation, transaction controls, conditional expressions, window functions,aggregate functions,CTEs, and stored procedures to facilitate customized aggregation, and reporting for multi-department analytics on enterprise dataset.
Supported movie data analysis with Excel tools like PivotTables to aggregate metrics and derive descriptive statistics on production budget and return on investment.
                        The project conducts an exploratory data analysis on a dataset of over 7,000 films to uncover insights into movie budgeting, performance, and correlations between key variables. The analysis focuses on identifying factors that may influence movie financial success. After cleaning the raw data and handling missing values, relationships are explored between budget, gross earnings, release year, production company & country, and major genre categorizations.
                        SQL code project for creating tables, inserting data, and performing various SQL operations. It covers basic SQL commands to more advanced concepts like CASE statements, UNION ALL, HAVING clause, UPDATE/DELETE operations, ALIASING, PARTITIONING, and use of STORED PROCEDURES.
                        Developed an interactive Tableau dashboard providing insights into Airbnb listings data for hosts and property managers. Performed data cleaning on listing details including location, reviews, availability, and pricing. Created visualizations including maps, charts, Aggregated metrics on listing performance over time and by neighborhood. The dashboard empowers users to analyze market occupancy rates and optimize pricing strategies to maximize revenue.
                        Designed interactive Tableau dashboard providing global sales and performance data for video content releases across multiple regions. This dynamic, visually rich dashboard enables media executives to quickly visualize and slice global sales data along several dimensions.